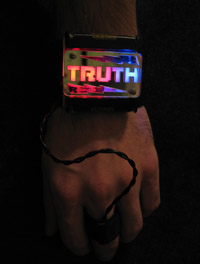
A wristband that dynamically reflects the wearer's psycho-emotional
response to the world, promoting internal states to be externalized
and made into interactive forms of expression. The device measures
the
galvanic skin response (a marker of emotional arousal commonly
used in lie detector tests), measuring micro-changes in sweating on
your hands. The device's lights turn from blue to red as the wearer
becomes excited. Telling a lie may make you sweat, but ask the right
question and the answer doesn't matter!
Truth TV!
Check out the Truth segment on
MakeTV (episode 107) airing on
PBS stations around the
U.S.
Truth for Sale! Truth Wristband Kit
- $44.95
NEW VERSION!
All easy soldering!
via paypal
Below is a video of my brother, Ian, wearing the Truth Wristband while I
ask him some questions to see what sorts of things get his Truth meter
going. Note that it takes 1-2 seconds for the psychodynamic response to
be expressed in the skin response.
(get
the latest flash player)
Truth for Sale! Truth Wristband Kit
- $44.95
NEW VERSION!
All easy soldering!
via paypal
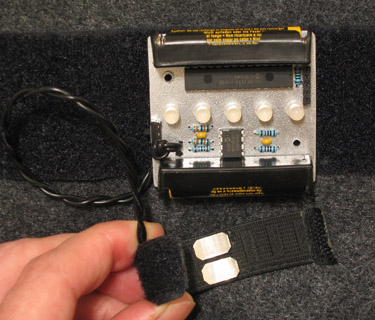
Kit includes:
All the parts you need... an etched PCB, a finger strap with sterling silver plates, a velcro
wristband, all the electronics (inc. a programmed pic), a laser
cut TRUTH face plate, instructions, 2 AAA batteries, etc.
Required tools:
Fine tip soldering iron, solder, pliers, wire cutter/stripper, flat
head screwdriver, scissors, isopropyl alcohol and a toothbrush (for
cleaning circuit board after soldering)
Tutorial: What is the
"Truth" and how do you measure it?
Background:
The Truth Wristband measures the
Galvanic
Skin Response (GSR). GSR is a measure of emotional arousal that is
detected as a sharp increase in electrical skin conductance.
Physiologically, this increased skin conductance is caused by a specific
type of sweat gland (eccrine, also called merocrine) that is tied in with
the arousal systems of the body, including adrenaline. When you get
embarrassed, angry, anxious or have other strong emotions, your skin
conductance shoots up reflecting the change in your emotional state. Due
to its tie with arousal as well as anxiety, the galvanic skin response is
one of the main components of a
lie detector test.
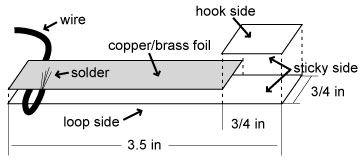
Electrodes:
Because sweat is electrically conductive, increases in sweating can be
measured as increases in skin conductance (i.e. decreases in skin
resistance). This skin resistance can simply be measured using two
metal plates against the skin.
The best materials for the electrode surfaces are non-reactive with
the skin, including gold, gold-plated copper, nickel-plated metal,
platinum, palladium, silver-silver chloride, etc., but any metal, even
two pennies, will work.
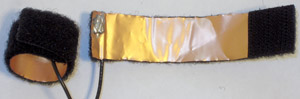
Palms, feet, armpits and the forehead have the highest density of
eccrine sweat glands, so for this tutorial we'll use a finger straps as a convenient electrode location.
Note that physically moving the electrodes can create spurious changes
in the resistance measured across the plates and contaminate our
measurement. There are ways to work around this, but it's not
completely trivial.
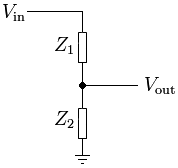
Voltage
Conversion:
The next step is to convert the
skin resistance to a voltage. This is easily done with a
voltage divider
(right). In this case Vin is the positive terminal of a voltage supply
(e.g. a battery), Z1 is the skin resistance across the metal plates,
Z2 is a standard resistor connected to the negative terminal of the
voltage supply, and Vout is the resulting voltage calculated as the
ratio [Z2/(Z1+Z2)]*Vin.
The skin resistance commonly fluctuates between 50K and 10M Ohms (and
even higher if your hands are really cold/dry), and a value in this
range will work for Z2. We will use Z2=10M because it serves to
linearize the relationship between Z1 and Vout, although at the
expense of creating a very high impedance (low current) circuit that
could be susceptible to noise.
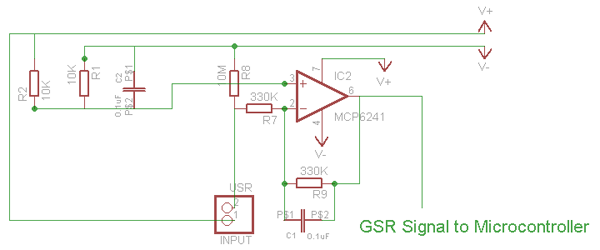
Buffering
and Filtering:
Because the
voltage resulting from this voltage divider is high impedance, it
is important to buffer the signal with an op amp. It is also a
good idea to filter the signal to remove any high frequency noise
(e.g. 60Hz). Because the GSR is a slow ~1-2Hz signal, we can
low-pass filter at 4.8Hz using a 0.1uF capacitor and two 330K Ohm
resistors calculated from Freq=1/(2*pi*R1*C) as in the circuit
below. The two resistors are the same value, so the circuit has no
amplification calculated at Gain=-R1/R2.
To accommodate non-linearities
of op amps near the voltage rails, it is generally best to set the (+)
input of the op amp to the middle of the power supply input, i.e.
1/2*[(V+) - (V-)], which is generated in the above circuit with R1,
R2, and C2.
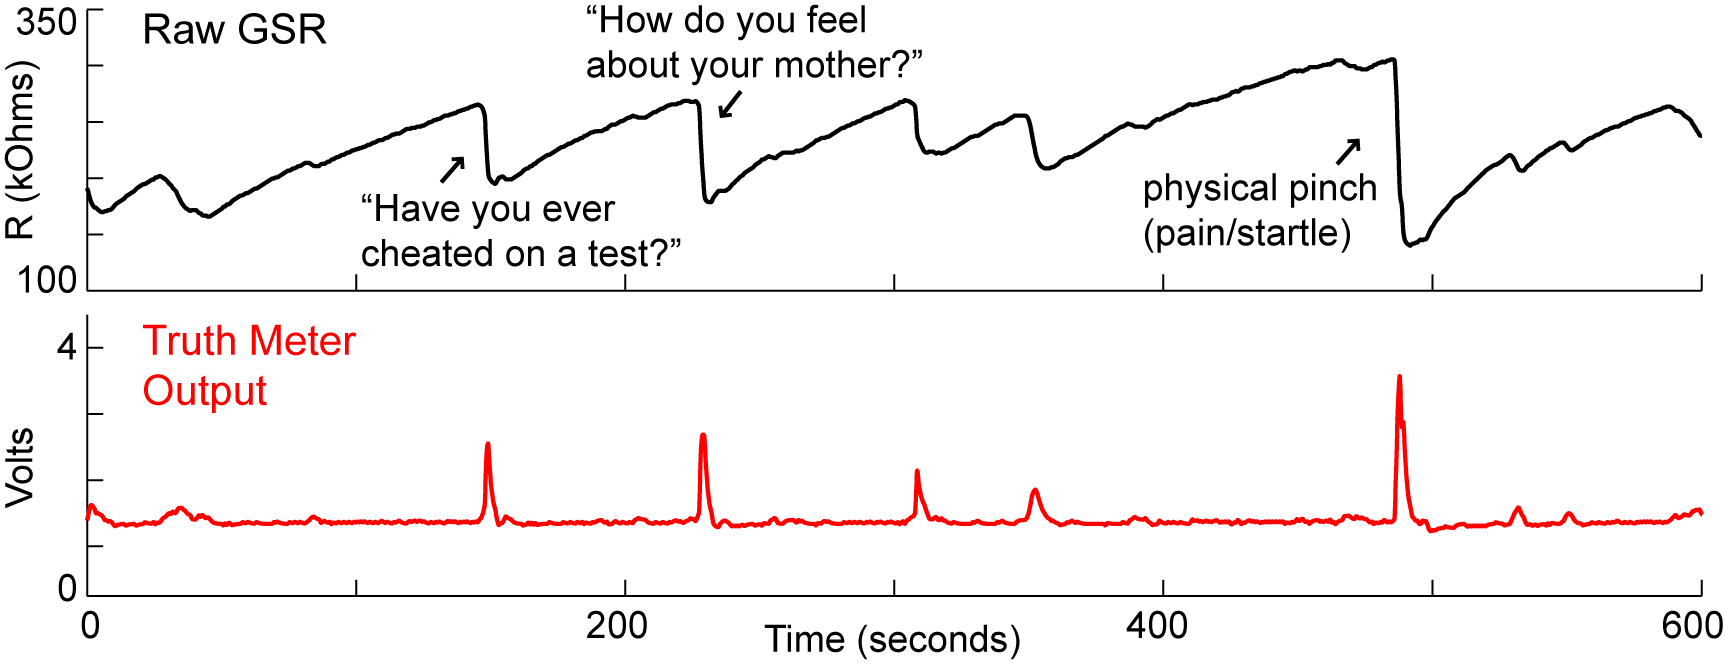
Analysis:
Our goal is to quantify the
magnitude of the GSRs to a given stimulus. The below figure takes a
look at the data to best determine an analysis method.
The top plot shows the voltage recorded off of the above circuit from
a nearly 6 minute recording. The sharp downward voltage deflections
are the GSRs and the slow creeping back up is likely due to
evaporation of sweat from the finger. Notice how hard it is to
quantify these responses with something simple like threshold values.
The bottom plot shows the same
signal after high-pass filtering at ~0.48Hz (i.e. ~2 seconds).
High-pass filtering is essentially subtracting the baseline average
skin resistance and revealing only the changes in skin resistance in
the time range of the GSR. This permits the system to quickly
"auto-calibrate" for different people and for changes in the baseline
skin resistance (e.g. due to evaporation). Notice how much easier it
is with the filtered signal measure the magnitude of the response with
simple thresholds.
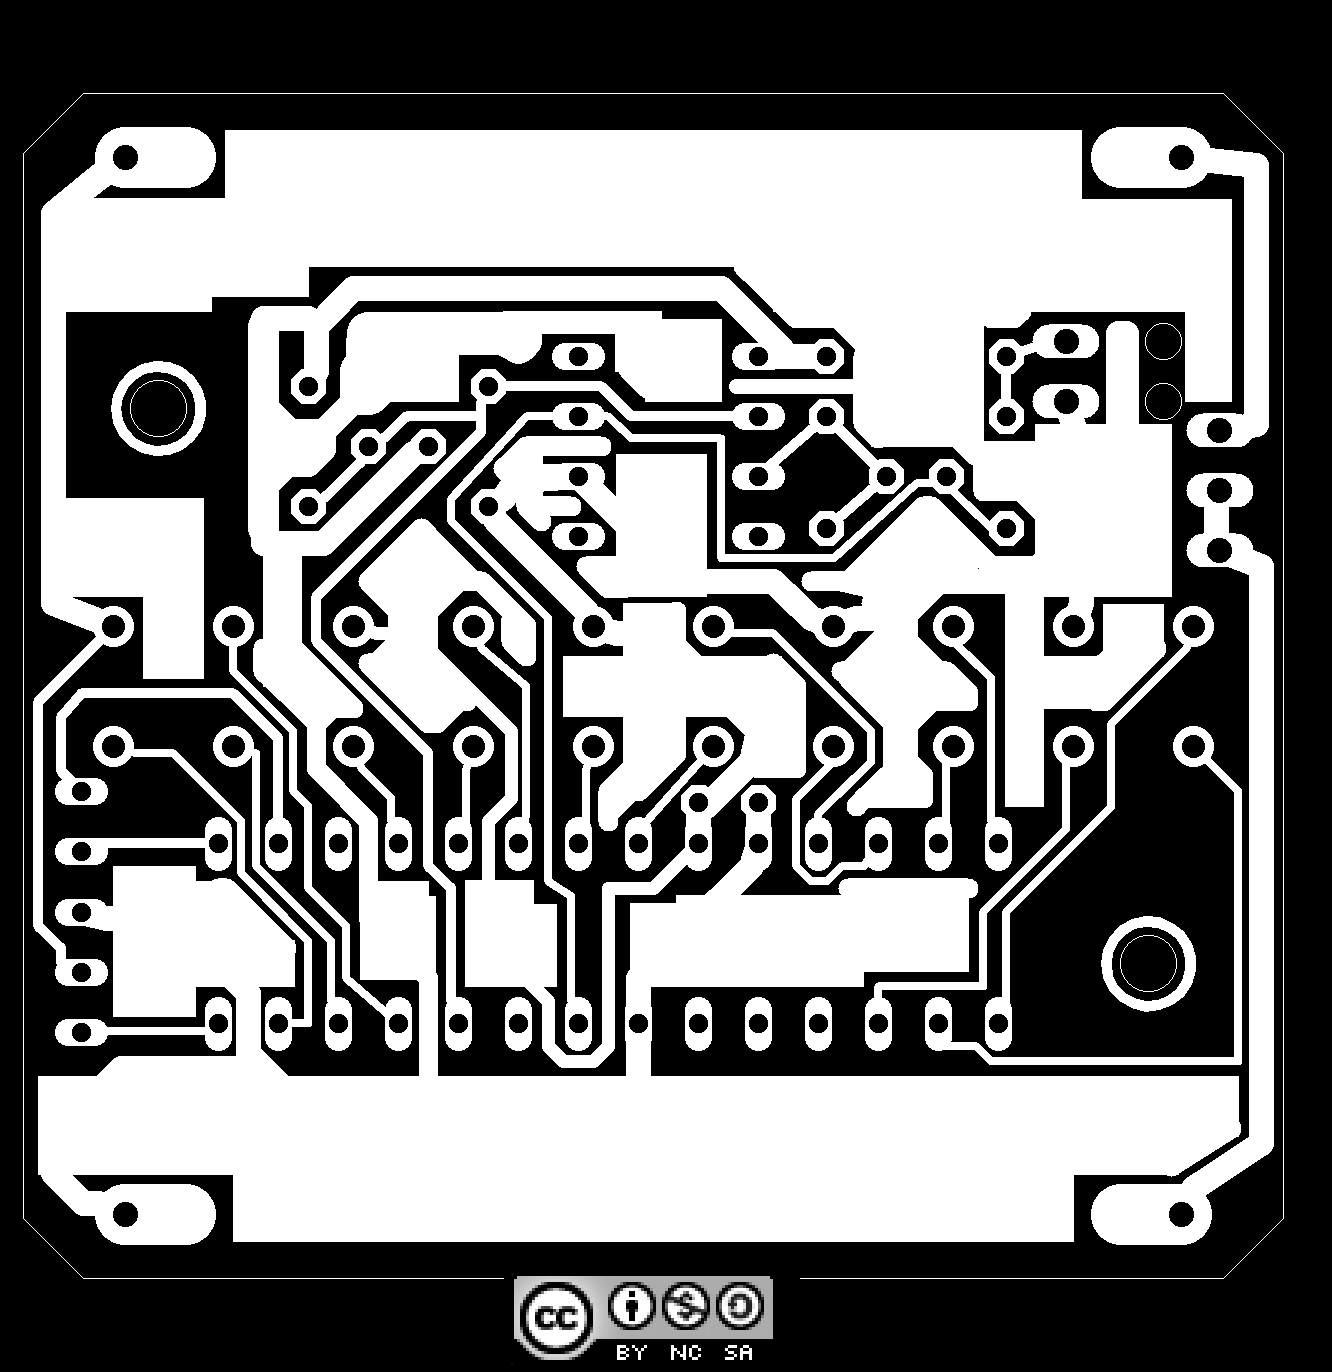
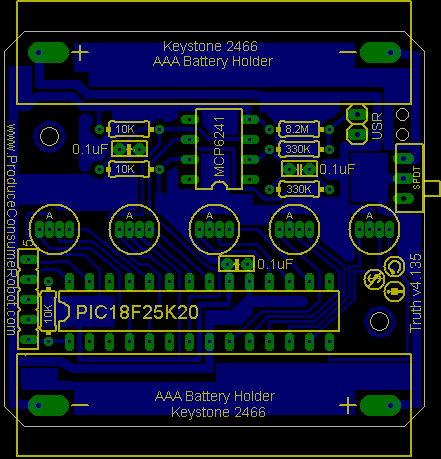
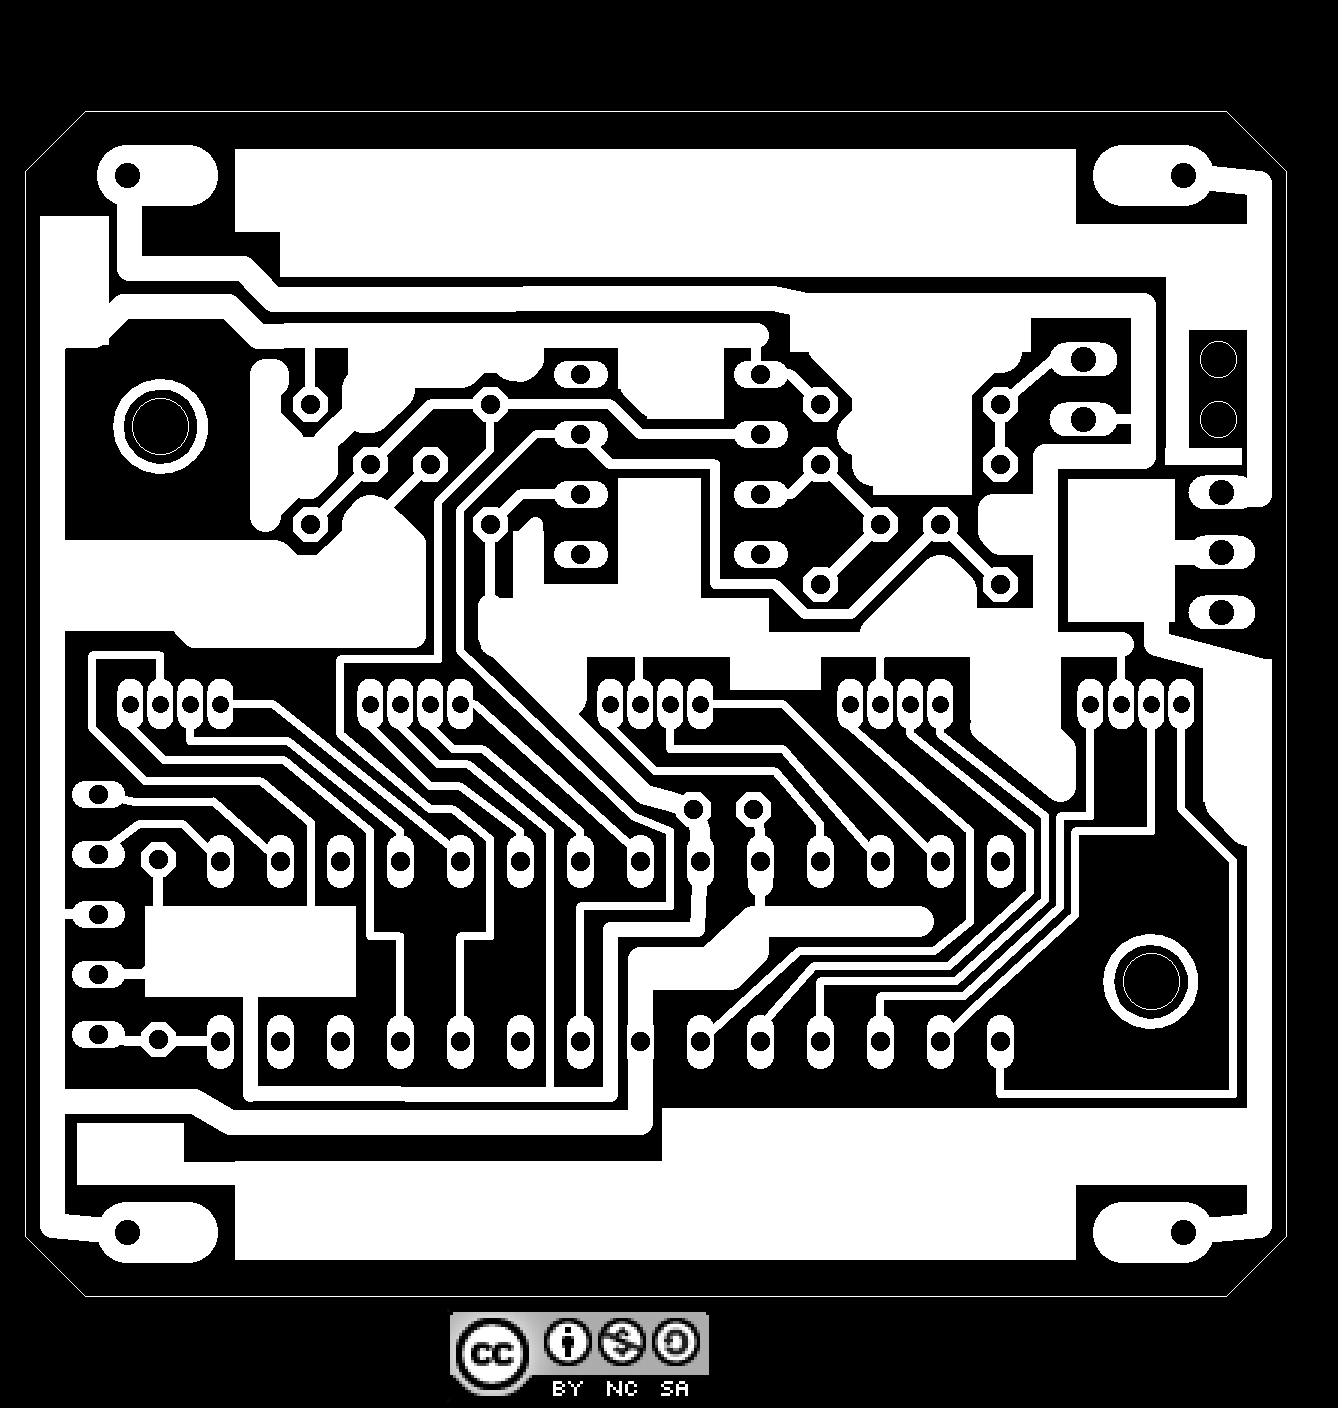
Using a
PIC for Analysis:
Similar to
the Truth Wristband Kit, we use a PIC microcontroller to read the GSR
signal, perform the high-pass filter described above and light up LEDs to
display GSRs.
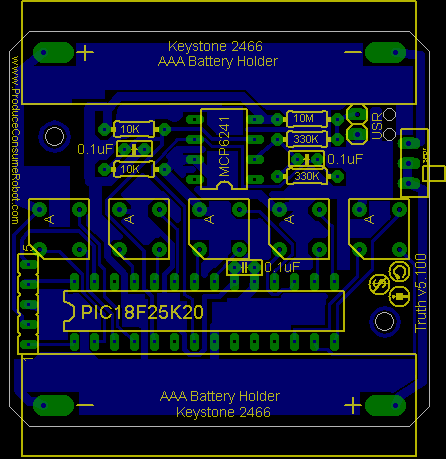
Bill of Materials (BOM)
1
pic18F25K20
Mouser
579-PIC18F25K20-I/SP
1
MCP6241
Mouser
579-MCP6241-E/P
2
330K resistor
Mouser
71-CCF07-G-330K
3
10K resistor
Mouser
71-CCF55-10K
1
10M resistor
Mouser
291-10M-RC
3
0.1uF capacitor
Mouser
K104K15X7RF53L2
1
RG LED
Mouser
696-SSL-LX5097IGW
2
finger plates
1
finger strap
2
AA or AAA batteries
Mouser
573-15A
1
battery holder
Mouser
12BH321A-GR
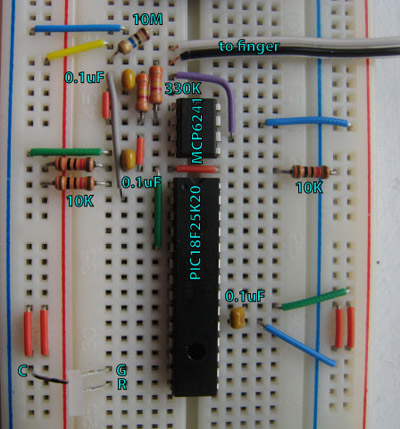
Here is the full circuit
implemented on a breadboard.
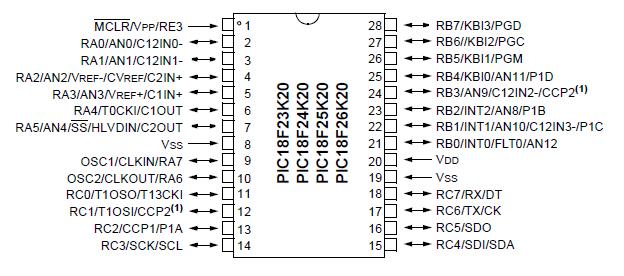
Below is a
pinout of the pic18F25K20 and here is the
full datasheet.
Under the hood, the pic is
essentially performing the following operations:
(1) Read the data
(2) Smooth the data to filter out high freq noise
(3) Calculate the average data value over ~2-3 seconds
(4) Subtract the "instantaneous" signal from the average (this is
essentially a high-pass filter)
(5) Set thresholds on the difference value to change the RG LED from Green
<-> Yellow <-> Red
Here are
some of the important variables and steps:
INTCONbits.TMR0IF
Timer used to trigger data
sampling. Samples at 50Hz, which is plenty of resolution to read and
smooth our 1-2Hz GSR.
smoothPeriod
Variable sets the weighting of
a smoother to remove high frequency noise (>3Hz) from our signal. This
smoothing is done "iteratively" so that each new data point is
incorporated with a running average according the weight.
normPeriod
Variable that is used to
iteratively calculate the average of the incoming data (over ~2-3
seconds). Note that calculating the average iteratively saves needing
to store large arrays of data usually necessary for calculating an
ordinary average.
threshold
The threshold increases
according to a cubic function so that a wide range of individual
differences in GSRs will be detectable by the meter.
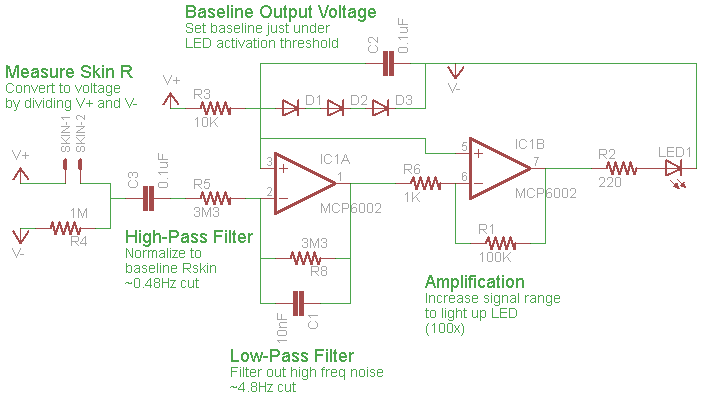
Alternative Without a PIC
Although
somewhat less flexible, it is also possible to create a basic Truth Meter circuit
without the use of a microcontroller as shown below.
Bill of Materials (BOM)
Quantity
Material
Vendor
Part #
2
0.75x3.5" loop
Velcro
ebay
2
0.75x0.75" hook
Velcro
ebay
2
1x3" strips brass
or copper foil
www.maximum-hobby.com
0.002 Brass Foil (42 gauge)
2
10" wire
mouser
2
2-pin header
mouser
517-6111TG
1
prototyping
breadboard with wire kit
ebay / sunpec
2
AA batteries
mouser
573-15A
1
2xAA battery
holder
mouser
12BH324A-GR
1
dual op amp
(MCP6002)
mouser
579-MCP6002-I/P
2
3M3 res
mouser
660-CF1/4C335J
1
1M res
mouser
660-CF1/4CT52R105G
1
100K res
mouser
71-CCF55-100K
1
10K res
mouser
660-CFP1/4CT52R103J
1
1K res
mouser
CFP1/4CT52R102J
1
220 ohm res
mouser
660-CF1/4CT52R221G
2
0.1uF cap
mouser
K104K15X7RF53L2
1
10nF cap
mouser
594-K103K15X7RF5TL2
3
diodes
mouser
78-1N4148
1
red LED
mouser
In this
circuit, a voltage divider is used to convert Rskin to voltage. The signal
is then band-pass filtered from 0.48-4.8Hz to "auto-calibrate" to
individual baselines and remove high frequency noise. The signal is then
amplified 100x to reach the a voltage high enough to light up an LED.
Using diodes to set the (+) inputs to the op amp about 1.6V above V-, the
output voltage of the circuit stays just below the threshold of the LED
until a GSR occurs. Depending on the current/voltage properties of the
diodes used, usually 2 or 3 diodes will be needed to set the "virtual
ground" of the circuit 1.6V above V-.
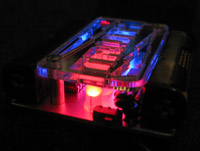
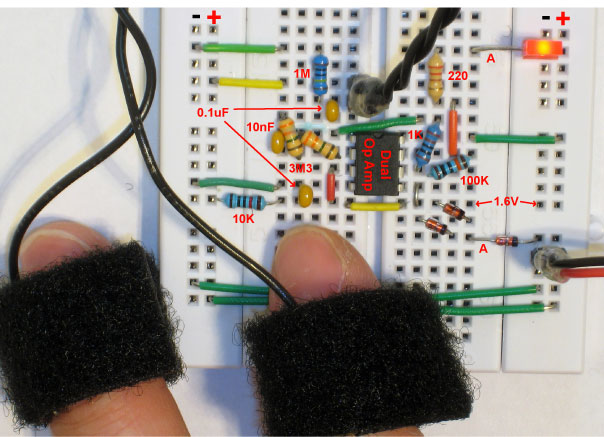
Below is a picture of the circuit on a breadboard.
This circuit
uses the dual op amp MCP6002. Other op amps may be used, but it is
important that the op amp used can operate within 1V of the negative rail.
R1 may be substituted swapped out to change the amplification. 200K will
provide 200x amplification and will make the circuit more sensitive.
This circuit will run on a range of
voltages (tested 2.5-6V) depending principally on the operating voltage
range of your op amp.

